Original research
The Partnerships Benchmark 2026
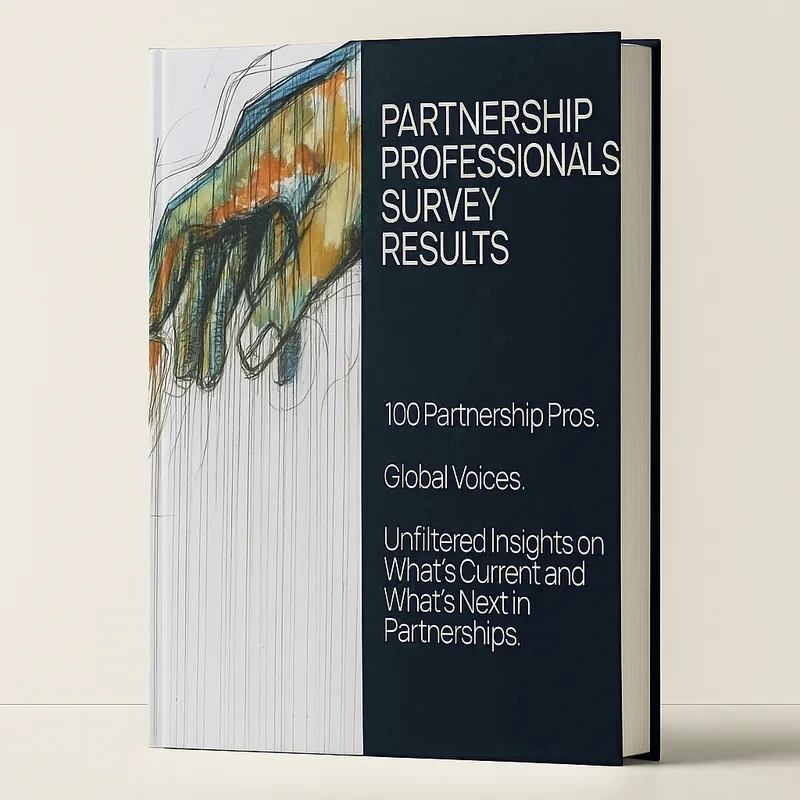
What 100+ partnership professionals actually do: how they are measured, how much of their pay is at risk, which partnership types they rate most valuable, and which tactics they say work.
- Respondents
- 102
- Fieldwork
- Sep to Dec 2025
- Questions
- 47
Five gaps worth closing
Each of these describes a gap between what partnership teams are shown to deliver and how their organisations resource, measure or reward them.
How the survey was run
102 partnership professionals answered 47 questions between September to December 2025. Responses were collected anonymously and no individual contributor is identifiable from the published data. Demographic information is aggregated for the same reason.
Response rate was 96% or more for questions 1 to 45, and 87% for questions 46 and 47.
Each percentage is the share of the people who answered that question, rounded half up to a whole per cent. Where a figure combines answers, such as 26% or more, it is computed from the combined count, so it can sit a point away from the sum of its rounded parts. Where a question asked for a top two or top three, the figure is the share who put that option in their selection.
The sample spans companies of every size the survey offered, from 50 or fewer employees to more than 10,000, and partnership models from referral through integration to strategic alliance. The survey did not ask where respondents are based; 92% say they manage partnerships across more than one region. That breadth is the point of a benchmark, and also its main limitation: tactics that work for a high-velocity channel programme often do not transfer to a long-cycle strategic alliance, and approaches built for North American markets usually need adapting for EMEA or APAC. Read these figures as directional evidence, not as prescription.
This is the 2026 edition, the first of the series. Fieldwork closed at the end of 2025, which is why the figures describe 2025 practice under a 2026 edition name. The next edition will add vertical-specific cuts and, once two editions exist, movement over time.
Revenue and strategy
Partnerships are a material revenue channel for most organisations, but measurement stays fixed on the two things easiest to count.
Respondents selected their top two.
- Referral82%
- Integration62%
- Strategic alliances47%
- Reseller / channel30%
Respondents selected their top three, so the bars total over 100%.
Source: Q2.
Activation and the partner's attention
The hardest part of partner management is not signing partners. It is getting a signed partner to prioritise you over everything else on their desk.
The internal blocker
Inside the company, the blocker is usually another team. Far more partner managers name other departments, engineering capacity or sales follow-up than name budget or executive support.
Running the programme
25% run partnerships on a PRM platform. 72% still use spreadsheets, and 51% settle multi-partner attribution by giving the credit to whoever touched the deal first.
Operations, tooling and attribution
Partner operations still run on the CRM and the spreadsheet. Account mapping tools are common, a PRM is not, and attribution defaults to the simplest possible model.
Respondents could select more than one tool.
Team structure and skills
The most common partner function is one to three people, and for 92% of partnership professionals operational work takes at least 40% of their time.
Respondents selected their top three.
- 80/20 relationships8%
- 60/40 relationships45%
- 50/50 even17%
- 40/60 operations18%
- 20/80 operations13%
Share of respondents at each split, relationship work first. Every respondent answered; the bars are rounded, so they sum to 101%.
Source: Q21.
Go-to-market and partner marketing
High-touch, data-led tactics beat digital-at-scale ones, and the budget does not follow the revenue.
Respondents selected their top three.
Respondents selected their top three.
Where it gets specialised
92% manage partnerships across more than one region, and 58% report that technical integrations run through 41% or more of their portfolio.
Cultural and global reach
Almost every partner programme now spans regions, and the friction is cultural and procedural more than a matter of communication style.
Technical partnerships and integrations
Most partner portfolios are substantially technical, and the constraint is resourcing rather than technical difficulty.
Reward, and what comes next
85% count revenue targets among the two main measures of their performance, and 6% relationship health. 45% name AI and automation as the trend that will most affect partnerships in the next three years.
Compensation and performance
The survey covers how pay is structured, not what it pays. What it shows is a function measured on revenue and reviewed on short cycles.
Respondents selected their top two.
What partnership leaders expect next
AI and automation top the list of forces expected to reshape partnerships, and ecosystem-led growth tops the list of predictions.
Respondents selected their top three.
Your own numbers
See your answers beside this benchmark
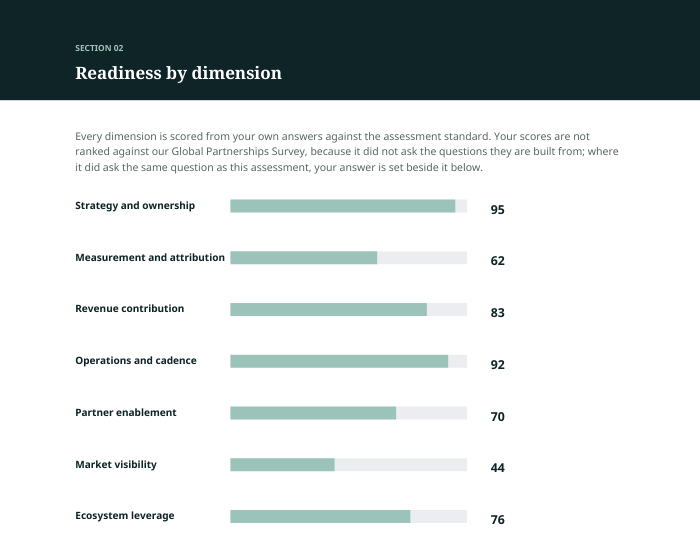
The Partnership Assessment reads your public partnership footprint, scores seven dimensions of readiness, and sets your answers beside the same questions in this survey. It names the gaps holding your programme back, partner targets where the evidence supports naming them, and sizes the opportunity from your own answers where they allow, with every finding resting on an answer you gave or a page we read.
Built for SaaS platforms and agencies. Free to start.
Questions this data answers
What percentage of revenue comes from partnerships?
73% of companies surveyed report that partnerships influence or source 26% or more of their revenue, and 11% report partnerships influencing or sourcing 76% or more. Only 2% report partner influence of 10% or less. Based on 102 partnership professionals surveyed between September to December 2025.
How many people work in a typical partnerships team?
43% of partner functions are run by one to three people, including 13% operating solo. 31% have four to fifteen people and 25% have fifteen or more.
What is the biggest challenge in partner management?
Partner activation, at 25%: getting a signed partner to actually produce. Internal alignment follows at 22%, resource constraints at 20%, attribution at 17% and lead quality at 15%. The most common reason a new partner fails to generate a first lead is competing priorities, named by 42%.
How many companies use a PRM?
25% use a partner relationship management (PRM) platform. The CRM is the most widely used tool at 86%, 72% still use spreadsheets, and 57% use an account mapping platform such as Crossbeam or Reveal.
How do partnership teams measure success?
86% name revenue generated among their top two measures of partnership success and 65% name leads sourced. Customer retention is a top-two measure for 13%, market expansion for 11% and brand exposure for 8%, even though 62% name integration partnerships among their three highest-value partnership types.
How is AI changing partnerships?
45% name AI and automation as the trend that will most affect partnerships over the next three years, more than any other option, ahead of ecosystem consolidation at 31%, economic uncertainty at 12% and platform dominance at 10%.
How much of a partnership manager's compensation is variable?
71% have between 11% and 40% of total compensation at risk, with 41% sitting in the 26 to 40% band. 85% count revenue targets among the two main measures of their performance, and only 6% relationship health.
How good are partner-sourced leads?
59% of respondents report that 41% or more of their partner-referred leads are qualified or sales-ready, and 40% see partner-sourced leads convert to opportunities at a rate between 41% and 60%.
Who ran this survey and can I cite it?
The Global Partnerships Survey was run by Convert Commerce with 102 partnership professionals between September to December 2025. Responses were anonymous. Every figure on this page is free to cite with attribution to Convert Commerce and a link to this page. For commercial reuse, publication or AI training, contact info@convertcommerce.com first.
Get the full report
The complete report adds the written analysis behind every question, the verbatim responses on the biggest challenges in partnerships, advice for people starting out, and a role-by-role guide to which sections apply to your situation. It is free.
Downloads run through My Partner Network, where an optional contribution goes to Cancer Research UK through #PartnershipsAgainstCancer. 100% of donations go to the cause, and the report is yours either way.
How to cite this data
Every figure on this page is free to quote in articles, decks, newsletters and internal business cases, with attribution to Convert Commerce and a link back to this page. Each figure carries its own anchor and a ready-made citation line, so you can point at the specific number rather than the report as a whole.
Convert Commerce, Global Partnerships Survey 2026, Q1 (n=102). https://convertcommerce.com/research/partnerships-benchmark-2026#revenue-share
For commercial reuse, use at trade shows, inclusion in a paid publication, or use as AI training data, please contact info@convertcommerce.com first so we can agree the terms.